|
pain is the world leader in the glazing and pigment production during years as well world leader in the export glazing and pigment production.
That is the result of the years of investment on know how (R&D), people training, raw materials presence and knowledge.
The R&D Spanish focus
The Spanish glazing and pigment producers to achieve a great percentage of its resources on the R&D. These questions as well the presence of the Spanish ceramic cluster (ceramic raw materials, ceramic tiles and ceramic machinery producers) focus the Spanish sector to the world leadership.
The International expansion
With the quality and R&D leadership the market leadership comes . In addition to the large Spanish people presence in the international ceramic markets was more easy the glazing and pigments expansion, first in the EU market and after in the rest: US, south américa, middle east, north Africa, eastern UE, far east and all the world. Today are present in each ceramic country or ceramic factory.
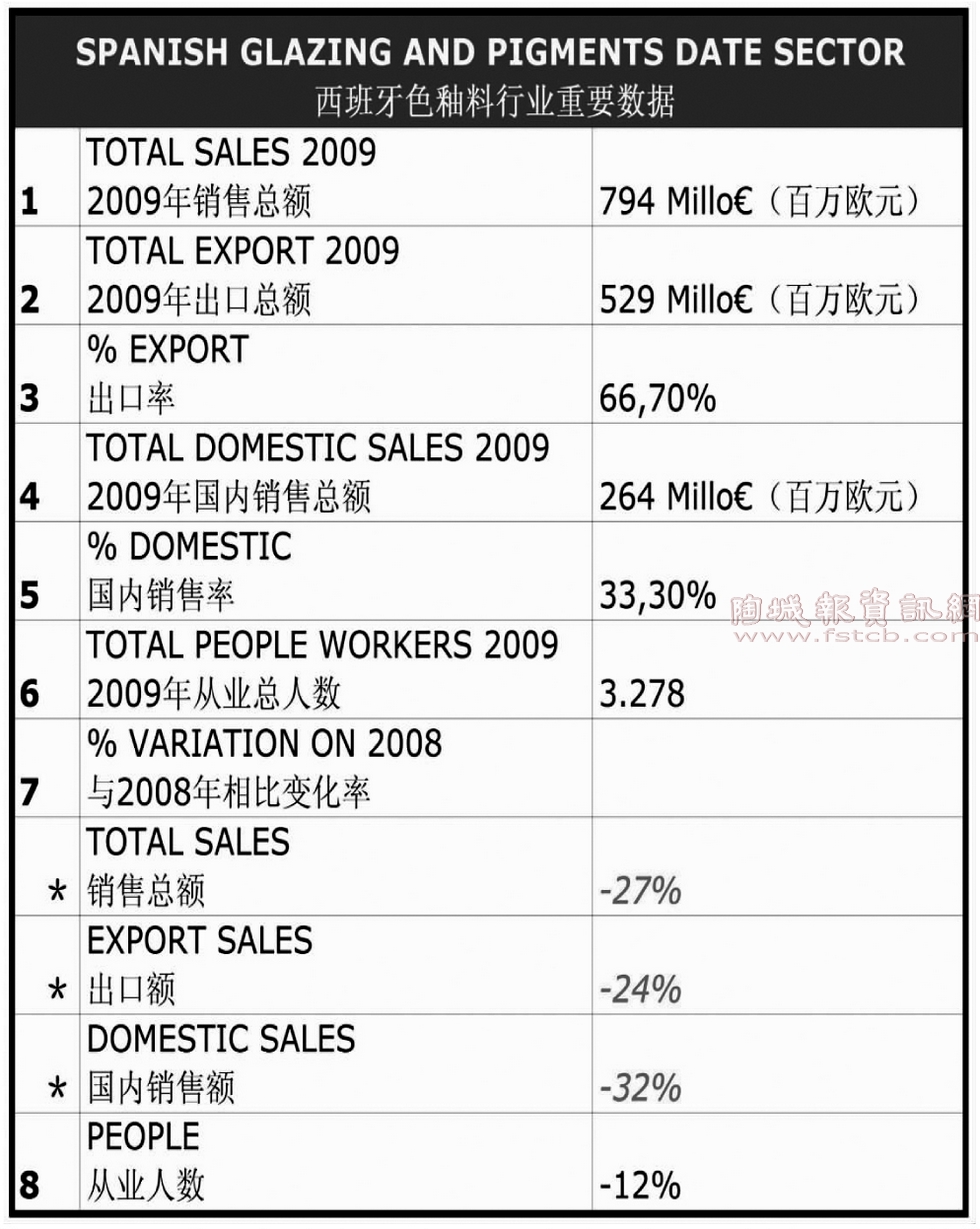
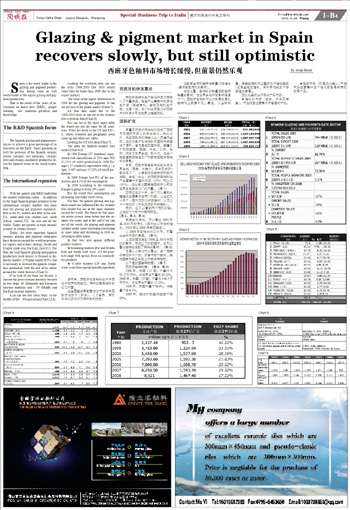
Today, the must important Spanish ceramic glazing and pigment companies have factories around the world as proximity logistic and technic strategy (South and Central América, Far East, East EU). For that, the local Spanish glazing and pigment production (look above) is focused to domestic market (35%)and export (65%) but is necessary to increase the spanish companies production with the rest of its others around the world factories.(Chart 1)
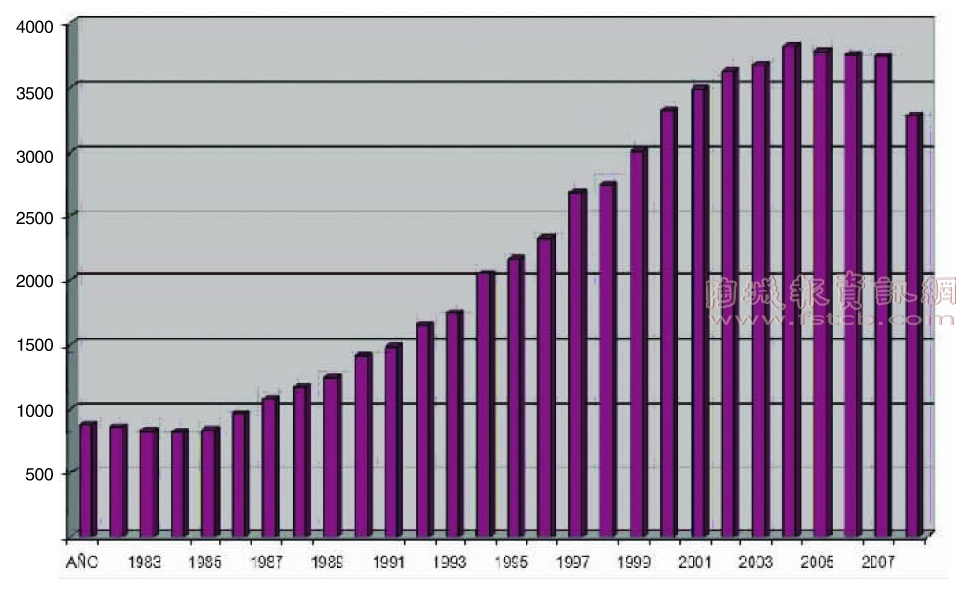
If we look all the three last decade, it can see the great increase specially focused in two steps: 90 (Domestic and European increase markets) and '00 (Middle and Far East increase markets).
Also can see two crisis steps: In the middle of the '90s and actual.(Chart 2,3,4)
Looking the evolution data can see the crisis 2008-2010 (the 2010 results come little bit better than 2009 due to the export market).
The areas of the export distribution in 2009 for the glazing and pigment. It can see the loss of the global market.(Chart 5)
All that data come due to the 2008-2010 crisis as can see at the ceramic tiles evolution data:(Chart 6)
But can see in the same upper table the results are not the same for all countries. While are down in the UE and EEUU, others countries and geographic areas come up and others are stable.
Looking the UE tiles data:(Chart 7)
The same for Spanish ceramic tiles sector:(Chart 8,9)
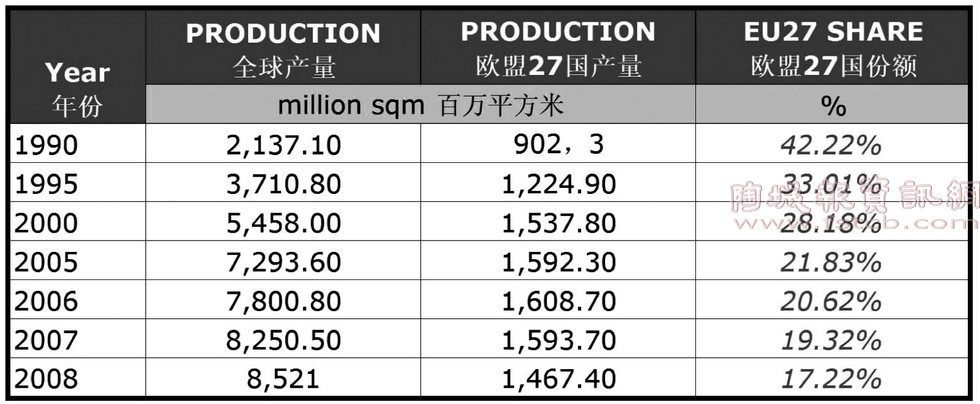
In 1990 Europe (27 countries) represented with sqm millions 42 22% sqm. 902 42,22% of world production.In 2008 Europe ( 27 countries) represented with p ) p sqm. 1.467 millions 17,22% of world production.
In 2008 Europe lost 8% of the production and 8,1% of the consumption
In 2009 according to the estimates Europe is going to loose 20% more
But the world tiles consumption are increasing also today (with crisis).
For that, the general glazing and pigment results are influenced for the ceramic tiles results but not at the same intensity around the world. The future for that spanish sector always come better that the ceramic tile sector and at the end if we can see all the world, the glazing and pigment ceramic sector come increasing (increasing in some areas and decreasing or little increasing in other areas).
In that way also appear different product markets
★Increasing markets (Far and Middle East and South América): All the products range with special focus on commodities products
★Stable markets (UE and North América): More special and effect products